I've been having Internet troubles. Why yes, I am in Australia! Funny you ask!
Update: I wrote a little script to do a regular HTTP GET and ran the tests again over a weekend. See Part 2 for more!
*sigh*
— Damian Brady 🥑 #BLM (@damovisa) September 3, 2020
Time to get out a Raspberry Pi and set up some stuff to continuously test my Internet.
Why?
Because I'm getting dropouts... but apparently not enough visible ones that @NBN_Australia will do anything. I need to prove it.
In summary, I've been getting really short drop-outs semi-regularly. Only a handful of times per day, and usually only for a few minutes at a time. Just enough to stop me in my tracks and force me onto a tethered mobile phone connection. I think Aussie Broadband (my provider) calls them "flaps", and according to their app, I've had 150 of them in the last 8 days.
The trouble is, I'm told NBN (Australia's National Broadband Network) doesn't see them as serious enough to trigger a response. An "outage" is something longer, and it's really only outages that matter.
So what can I do?
After a swathe of other troubleshooting attempts, one of the representatives at Aussie Broadband (and I want to be clear - I love Aussie) suggested I keep my own records. They can track outages, but there's only so much they can see from their end. They know NBN won't do anything without proof. This suggestion was echoed by a number of friends and colleagues.
My solution
Suggestions ranged from just keeping a ping running on a laptop, to setting up an end-to-end tracing solution using half a dozen Azure resources and client applications.
Instead, I implemented something in the middle - albeit a bit closer to the former.
Thanks to @vaughanknight and others, I now have a raspberry pi set up to do a speed test every 15min, and a ping every 1min.#JustAustraliaThings
— Damian Brady 🥑 #BLM (@damovisa) September 7, 2020
Presumably in a couple of days I'll be able to hand the files to @Aussie_BB so they can hound @NBN_Australia about mini dropouts.
I wanted something pretty simple, so I just set up a couple of cron jobs on a Raspberry Pi - using the Ookla Speedtest CLI, and a standard ping.
First, I needed the Speedtest CLI. On my Pi running Rasbian, I installed that fairly simply with easy_install:
sudo easy_install speedtest-cli
Once installed, if you run speedtest from your commandline, you get a nice result... but it's not very parsable if you want to keep track over a period of time.
Thankfully, the CLI has a couple of arguments that will help populate a CSV, and you can use standard shell features to append to a file.
First, I created a new CSV file with headers using the --csv-header argument and piping to a new file:
speedtest-cli --csv-header > speedtest-track.csv
Then, to test it out, I ran a speedtest with the --csv argument, appending to that file:
speedtest-cli --csv >> speedtest-track.csv
Now to set up a cron job to do it every 15 minutes. You can set this up with the crontab -e command. One sticking point I encountered (thanks Vaughan Knight for helping diagnose) - you'll need the full path to both the CLI and the output file in your cron job.
# run this every 15min
0,15,30,45 * * * * /usr/local/bin/speedtest --csv >> /home/pi/speedtest-track.csv
The result (after running it for a while) is a nicely parseable csv file!
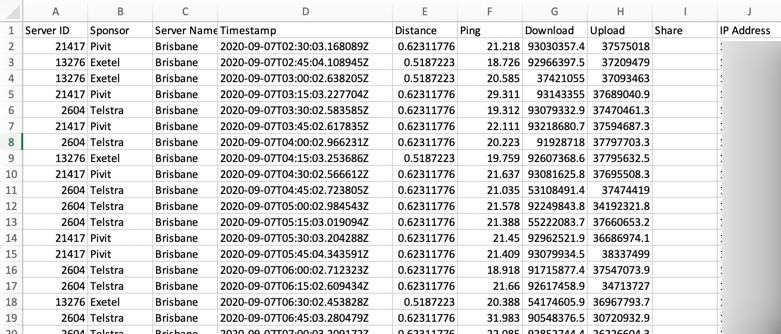
I mentioned, however, that the dropouts were only for a few minutes at a time, so there's a good chance I'll miss some if I'm only testing every 15min. I could do a speed test more often (and I might if I'm not getting the details I expect), but I figured a ping every minute would be enough to at least see those additional drops.
Again, a straight ping will give me plenty of details, but they're not terribly parseable if appended to a file.
A bit of google-binging led me to this solution:
# large ping every minute
* * * * * ping -c 1 -s 65507 aussiebroadband.com.au | head -n 2 | tail -n 1 | perl -nli 'print scalar(localtime), ": ", $_' >> /home/pi/pingtest.txt
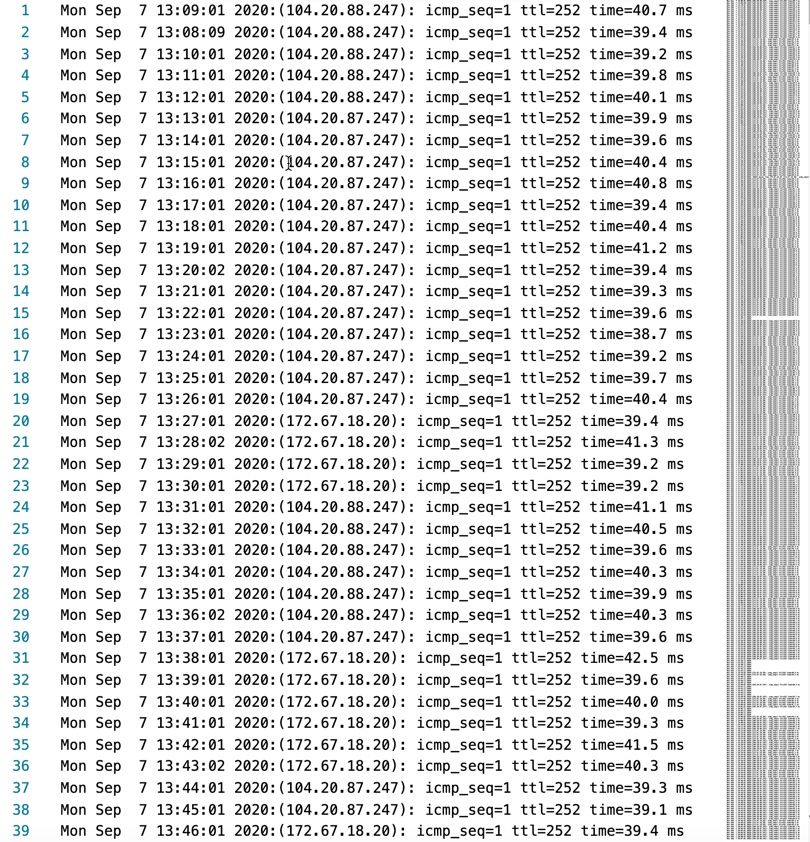
In short, I'm running a single ping of maximum size against aussiebroadband.com.au. I'm pulling out the second line of the output (the important one), prepending the current time, and appending it to the pingtest.txt file. Simples!
This is the result, and you can already see some outages in the preview strip in the right-hand side in Visual Studio Code.
The results
First the speed test. I let this run for just under 24 hours and charted the result:
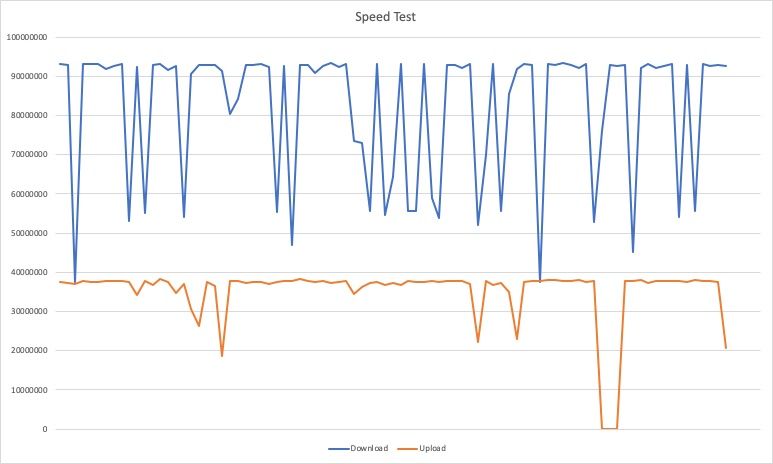
It's not horrible, but you can see it's very inconsistent. There's even a drop with no upload at all for half an hour or so.
What about the ping? This one has run for about 21 hours so far, and you can see the results below.

You can see a couple of legitimate outages, one for only a couple of minutes, and one on and off for about 25 minutes.
What's interesting is that these traces are over approximately the same time period. If you overlay those graphs, the outages don't line up. At all. So sometimes the ping shows a failure, and sometimes the speedtest shows a failure.
If you add them up, that's at least 3 periods of serious instability over about 21 hours. Not insignificant.
My plan is to keep this running over the next couple of days, then present the results to Aussie Broadband with the hope that there'll be an escalation. Fingers crossed!