Today, Anthony van der Hoorn and Nik Molnar announced the release of a new version of Glimpse with a big new feature - the Heads Up Display.
I've been lucky enough to see this new feature grow into its current form and in my opinion, it takes this tool from the "very useful" category into the realm of "must have".
SSW has been recommending Glimpse for some time. With the addition of this feature, we now recommend you use it all the time!
The New HUD
Assuming you're familiar with the previous version of Glimpse, you'll know that once it's set up and turned on, you see a small icon on the bottom-right of your screen (I often keep Glimpse running while I'm in development, and whenever I want to know about what route was hit or how many SQL queries were executed for this page, I'll click the icon and have a look.
The point is, I have to look. Glimpse required the developer to actively investigate. The new Heads Up Display changes the game - now I don't have to be looking for the cause of a problem, the information is there all the time. You now have a very powerful and proactive tool at your disposal.
Example Time!
I frequently use Glimpse to verify that a page I'm looking at doesn't suffer from the dreaded N+1 Selects problem you can get with a lot of ORM tools. The SQL tab (see Glimpse.Ado and Glimpse.EF) let me see what queries are being run against my SQL server. If I see a lot, there's likely to be a problem.With the new Glimpse HUD, that information is always there whether I'm actively looking for it or not. While testing one of the pre-release versions of the HUD, I noticed a page on a project I was working on that resulted in 74 SQL queries. Had I been using the old version of Glimpse, I may not have noticed (I wasn't working on that page)!
Here's what I saw (minus the issue):
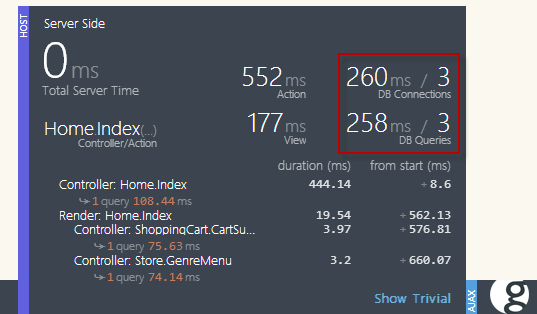
Above, you can see the number of Database queries and the time taken for those queries. In my case, I noticed this number was a really high. To investigate further, I can hover over the "Host" section to get some more info.
In this example, we can see that not only were there three queries, we actually have three connections. In my case, the 74 queries were shared over maybe a dozen connections. Something was going wrong here. You'll note we can see lots more information about what's going on in terms of Controller Actions and Views as well.
As with previous versions, we can click the (new) Glimpse logo to expand Glimpse into its full view, showing us the actual queries that were run against the database. The UI here has been updated as well and is very clean and "metro-y". This is where I could see all the repeated queries that were running against my SQL Server.
Without the HUD, I probably wouldn't have noticed there was a problem until much later. Because the HUD gives me this info in a relatively subtle way, I caught this issue quite quickly.
Summary
Glimpse now has three modes of delivering you data instead of just the one, and the HUD is the big game-changer here.First, you get a Heads Up Display (HUD) that I'd strongly recommend you keep open at all times while developing. It lets you monitor the performance of your application without getting in your way. More importantly, it's likely to show you issues preemptively rather than waiting for you to investigate.
If you hover over one of the HUD sections, it expands to give you even more info - this lets you investigate a bit further while still staying out of your way for the most part.
Finally, the full view of Glimpse gives you the UI you're probably used to if you really want to dig deep.

