Every year, DORA (DevOps Research and Assessment) releases an awesome "State of DevOps" report based on tens of thousands of surveys responses. For loud, talky DevOps people like me, it's an awesome opportunity to a) validate, and b) justify all the stuff we say is important.
The report is put together by Nicole Forsgren, Jez Humble, and Gene Kim. You should follow them (and me) on Twitter.
The 2018 report came out a few days ago, so I sat down to read it and summarise my highlights!

After 25 pages, I realised I was just writing bullet points of the whole report.
Yeah, highlights aren't highlights if they just summarize everything.

So that leads to my first recommendation:
Read the whole thing.
Then a couple of days later, read it again.
And then later that week, you've probably forgotten it, so read it again.
My highlights
Ok, I'll give you some highlights anyway. I managed to find highlights in my summary. Then highlights in those highlights.
The research itself used cluster analysis to group the respondents into three "software delivery performance" groups - high performers, medium performers, and low performers. There are also a couple of subgroups. Elite performers is a subset of high performers, and a really interesting "misguided performers" is a subset of low performers - more on that later.
So how are these groups measured?
Four measures you should care about
There are four key measures you should care about when it comes to software delivery performance:
- Deployment frequency (how often you can push into production)
- Lead time for changes (how long it takes to get a change from commit to production)
- Time to restore service (When stuff goes wrong, how long does it take you to fix it)
- Change fail rate (how often do your changes break stuff)
Here's how the best and worst groups compare:

That's the page you want to print out and hand to your manager. Convert that human-resource-time-dollars (or whatever managers use) and it can be pretty compelling. 💰💰💰💰💰
Misguided performers
One of the more interesting parts of this report was the discussion on misguided performers.
There is a tendency, especially in highly-regulated industries, to slow down. Be careful and cautious and make sure nothing can go wrong. You ask what happens when something does go wrong with a deployment and it's often deflected with, "Oh, it won't. We've made sure."
So then it does go wrong and because there's no process for dealing with this, the time to recover is horrible.

These are "misguided performers". Low performers, but with reasons*.
The data shows that these teams actually do tend to make fewer mistakes. Their change failure rate is better than other low performers. Not as good as medium performers, but better than the lowest.
Where this all falls down is the recovery. When it comes to recovering from an issue, they're worse than low performers. Like way worse. Up to 6 months worse.
Manual work
Measuring how much time is spent on manual work is a great way of measuring quality. There was a really interesting set of measures here too.
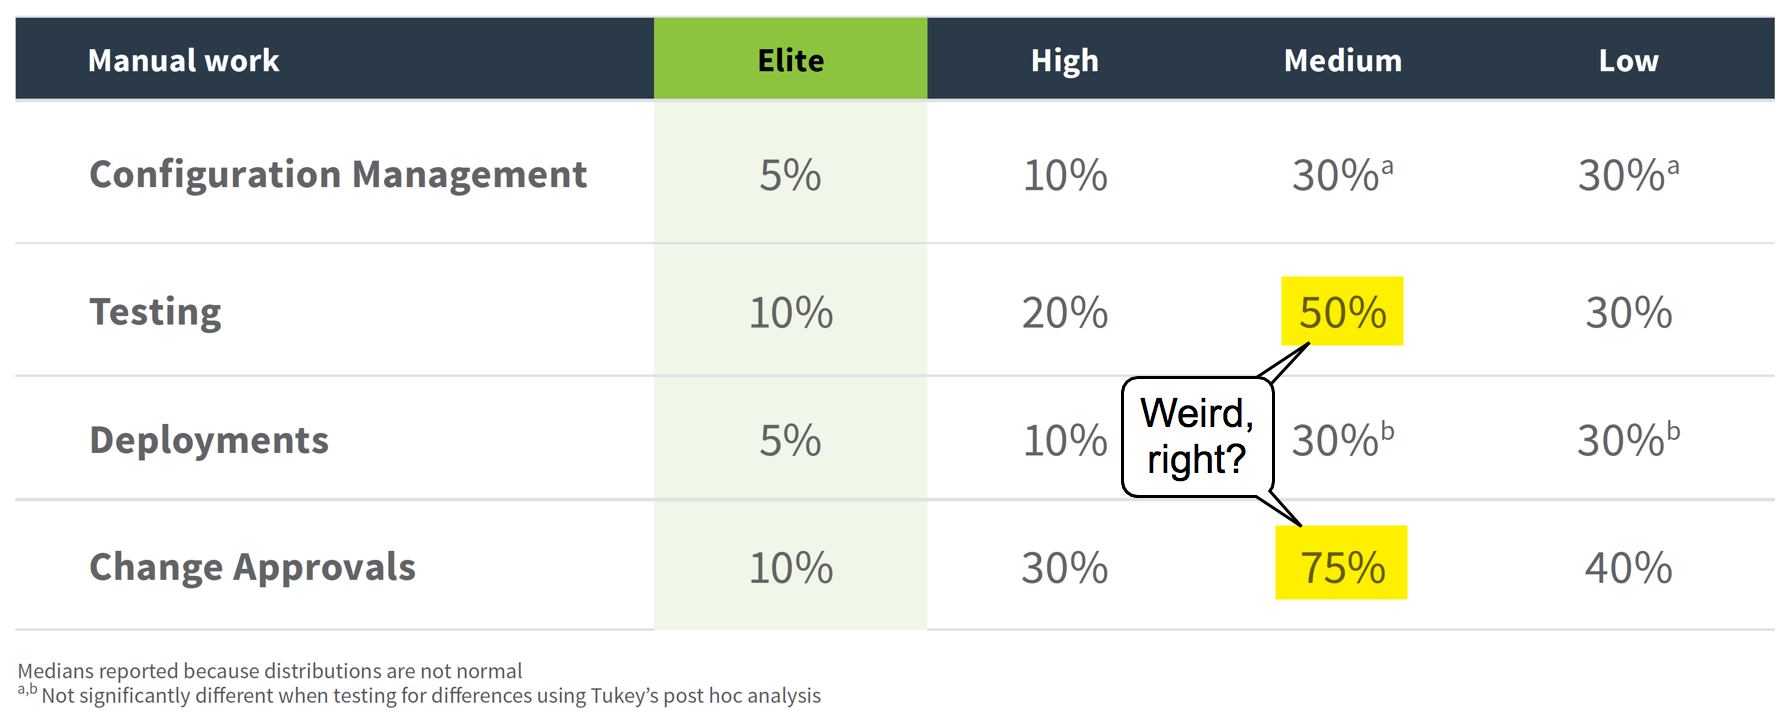
The medium group in that table is interesting and seems wrong at first glance - why would they be doing more manual work?!
But as the report explains, it makes sense. As teams start improving and automating things, there's suddenly a lot more testing that needs to happen. Technical debt builds up and can block progress. It's only after continually improving things that things start looking better.
So, like... "don't give up!" or something equally inspiring.

The rich get richer
One interesting thing in this report was that the best performers are getting better, and the worst are getting worse.
Compared with previous years, low performers have more failures and take longer to restore service. The gap is widening.
As DevOps matures in a lot of organisations, it's understandable that the highest performers continue improving, but why are the lowest performers getting worse?
Maybe it's the complexity of applications these days (microservices anyone?). Maybe it's doubling down on proven bad ideas?
Maybe it's viral chaos engineering meets artificial intelligence and the start of Skynet?

Do Cloud, but do it properly
If you're on the cloud, it's important that you are actually doing cloud stuff.
Ok, that doesn't make much sense. Let me try again.
The report references the NIST definition of cloud computing, which defines five essential characteristics. Things like on-demand self-service, and rapid elasticity. You can think of these characteristics as representing "doing cloud properly".
If you're just running a VM in the cloud, but doing everything else the same, you're probably not checking those 5 boxes. But if you actually meet all these cloud characteristics, you're 23 times more likely to be in the elite group when it comes to software delivery. That's a lot of times.

Outsourcing is bad m'kay?
This was really interesting. As a dev who has worked in quite a few companies across quite a few industries, it absolutely rings true. But that was just my anecdata. This puts real data behind that idea.
In short, if you outsource by function (e.g. all your testing goes to this third party company, or all the dev work is done by another org), you're far more likely to be in the low performing group.
And remember those Misguided performers? Yeah, turns out they're the worst for this. They use more functional outsourcing than any other group.
The reason? Contracts and agreements and change requests and batched work and all that stuff. Can you tell I did an MBA?

Look, all features are not equal. And if there's an agreement to deliver 10 features as part of some work, then it's possible that really important features are waiting around for nice-to-have's just to fulfil that agreement. I've seen it many, many times. It's nice to see my feelings backed up it in a real report.
A few other quick snippets
I realise I'm in danger of just summarizing the whole report again, so here are a few other highlights:
- Continuous Delivery contributes to reductions in burnout!
- If software relies on anything that's handled in a different department (e.g. infrastructure, security, databases), a) involve those teams super early (shift left!) not at the end, and b) include them in the software delivery process
One more that was amazing (from Google research):
- The most important factor in predicting a high-performing team is psychological safety.
Yep. If you feel safe taking a risk or admitting a mistake, your team will perform better.

Final note
Remember, all of this ties back to organisational performance. That's super important. If all these recommendations just made you better at delivering software, but that didn't have any impact on your bottom line, then why bother?
But it does. Regardless of industry.
Teams that are elite performers when it comes to software delivery and operational performance are 1.53 times more likely to meet or exceed their own goals.
So this stuff works.

Again, check out the whole report, and let me know your thoughts!